Climate Trends
Ocean Heat Content
Pentadal (rolling 5-year mean) global ocean heat content anomalies for two depth layers, from the NOAA/NCEI Global Ocean Heat Content Climate Data Record (Levitus et al. 2012; Reagan et al., ongoing). Values are expressed relative to a 1955–2006 climatology. Shaded bands show the standard error of the estimate. Data are served live from the NOAA THREDDS server via OPeNDAP.
Fetching OHC data from NOAA…
Time axis: Each point represents the central year of a rolling 5-year (pentadal) mean. The series runs from 1957.5 (pentad centered on the 1955–1959 period) through the most recent complete pentad.
Data: NOAA/NCEI Global Ocean Heat Content CDR (doi:10.7289/V53F4MVP). Levitus, S., et al. (2012), Geophys. Res. Lett., 39, L10603.
Earth Energy Imbalance
Monthly global mean top-of-atmosphere net radiative flux from the CERES EBAF-TOA Edition 4.2.1 product (NASA LaRC ASDC). A positive value means the Earth is absorbing more energy than it emits — the Earth Energy Imbalance (EEI). The bold line is a trailing 12-month running mean, which removes the large seasonal cycle (±10 W m−2) and reveals the underlying trend.
Loading EEI data…
Seasonal cycle: The raw monthly EEI varies by roughly ±10 W m−2 due to hemispheric asymmetry in land/ocean distribution. The 12-month trailing running mean (average of the current and preceding 11 months) removes this cycle to expose the multi-year trend.
EBAF constraint: The CERES EBAF product adjusts the global mean TOA net flux to be consistent with independent estimates of ocean heat uptake, so the annual mean EEI is not a purely radiometric measurement but a constrained estimate.
Data: CERES EBAF-TOA Ed4.2.1, doi:10.5067/…L3B004.2.1. Loeb, N. G., et al. (2018), J. Climate, 31, 895–918. Local CSV updated monthly by GitHub Actions.
Total Solar Irradiance
Total solar irradiance (TSI) is the solar energy flux at the top of Earth's atmosphere. The NOAA/NCEI Total Solar Irradiance Climate Data Record (Coddington et al., NNLTSI1 model, CDR Version 3) combines multiple satellite missions to produce a continuous record from 1610 onward. The 11-year solar cycle is clearly visible, particularly in the 20th–21st century satellite era. Here we show both yearly averages (spanning 416 years) and monthly averages (since 1874) with uncertainty estimates.
Loading TSI data…
Solar cycle: TSI varies by approximately 0.1% (roughly 1.4 W m−2) over the 11-year solar activity cycle. The record shows no long-term trend in TSI over the past ~400 years, indicating that increasing solar output is not responsible for recent global warming.
Data: NOAA/NCEI Total Solar Irradiance CDR, doi:10.25921/k2ff-p712. Coddington, O., et al. (2023), Earth Syst. Sci. Data, 15, 5473–5506. Local CSVs updated quarterly by GitHub Actions.
Aerosol Optical Depth
Monthly aerosol optical depth (AOD) at 550 nm from two satellite records. AOD is a dimensionless measure of the total column extinction of sunlight by aerosol particles; higher values indicate more aerosol loading (dust, sea salt, smoke, pollution). The global mean varies seasonally and interannually with wildfire events, dust outbreaks, and pollution. Toggle sources and regions using the controls below.
Loading AOD data…
Means: Area-weighted (cosine-latitude) means over all retrieved pixels.
Sentinel-3A (2017–present): CDS Satellite Aerosol Properties — SLSTR/Sentinel-3A, ENS algorithm, monthly average, v2.4. Ocean pixels only (land excluded by algorithm mask). CSV updated automatically using a Python script.
MODIS/Aqua (2002–present): MYD08_M3 v6.1 — Level-3 monthly atmosphere product,
Aerosol_Optical_Depth_Land_Ocean_Mean_Mean, 1°×1° global grid.
CSV updated automatically using a Python script.
Earth's Surface Albedo
Monthly broadband land surface albedo — the fraction of incoming solar radiation reflected by the land surface — from two satellite records. White-sky albedo is the reflectance under fully diffuse illumination; black-sky albedo is the reflectance under direct-beam illumination at local solar noon. Higher values (bright deserts, snow, ice) reflect more sunlight back to space. Both products cover land only — ocean and sea-ice albedo, and atmospheric albedo, are separate components to be added later. Toggle sources, sky type, and regions using the controls below.
Loading surface albedo data…
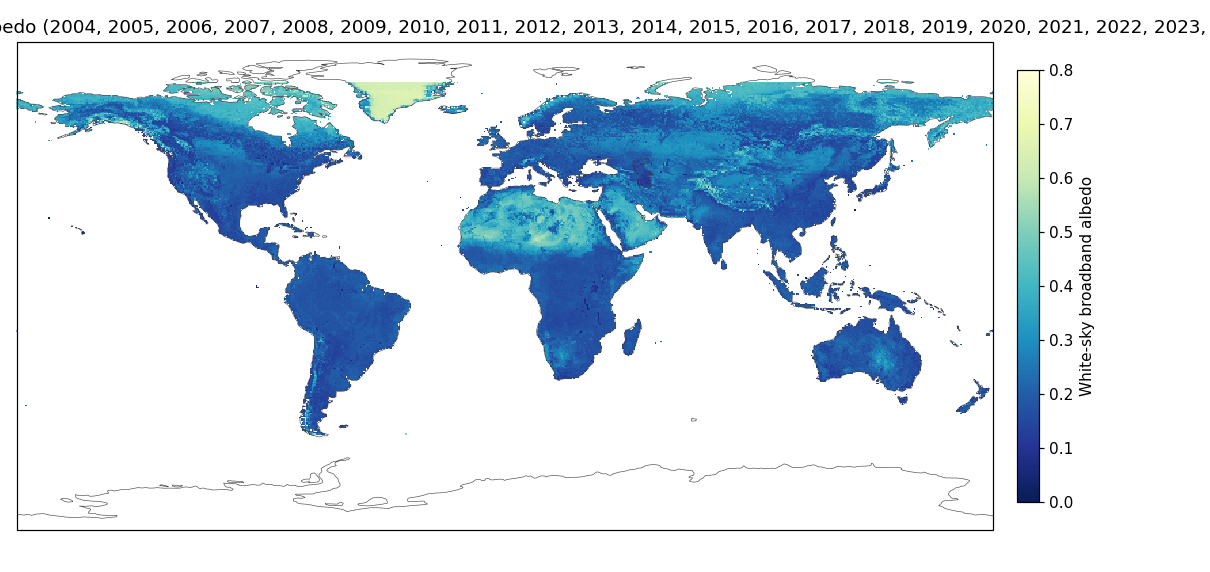
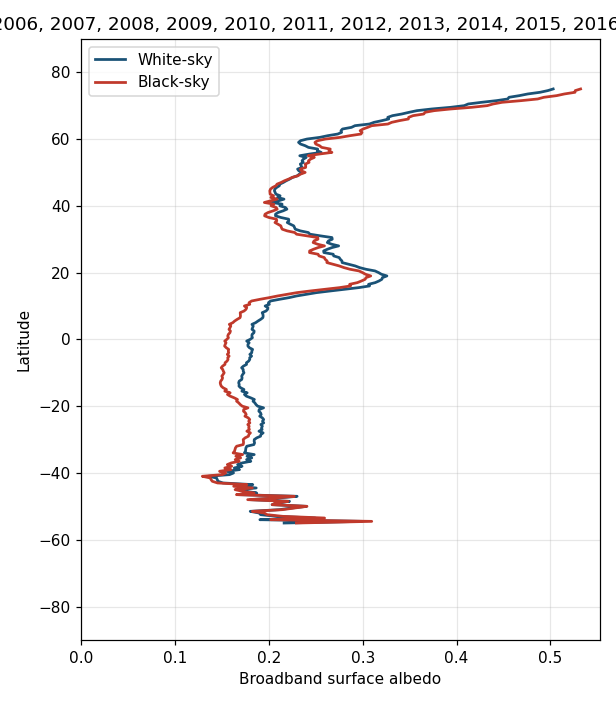
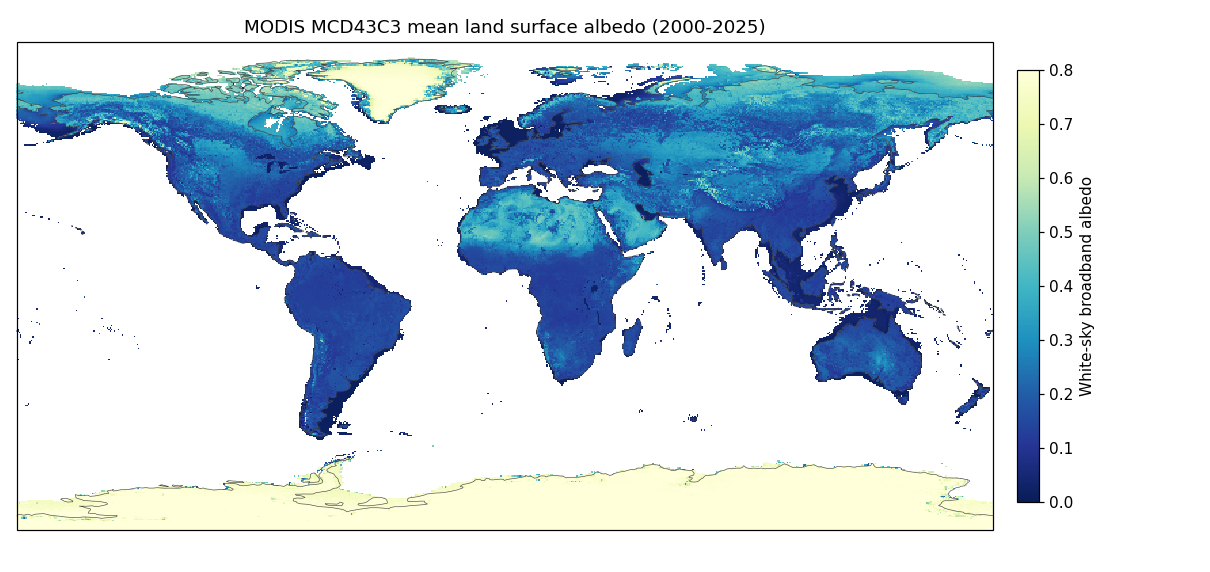
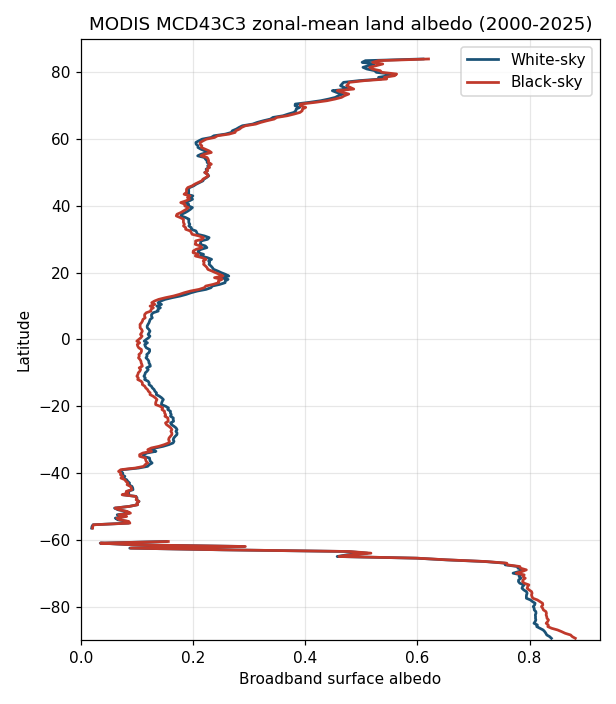
Means: Area-weighted (cosine-latitude) means over retrieved land pixels; ocean is excluded by both products.
C3S / AVHRR (4 km record): CDS Satellite Albedo — broadband white-sky (ALBB-BH) and black-sky (ALBB-DH), AVHRR/NOAA-17, 10-daily, v2, aggregated to monthly. CSV and figures generated by
scripts/update_albedo_c3s.py.MODIS MCD43C3 (2000–present): MCD43C3 v061 — CMG 0.05° BRDF/Albedo,
Albedo_WSA_shortwave / Albedo_BSA_shortwave, one granule
per month. CSV and figures generated by scripts/update_albedo_modis.py.